
Dashboard
Use Dashboard after publishing when you need analytics instead of editing tools.
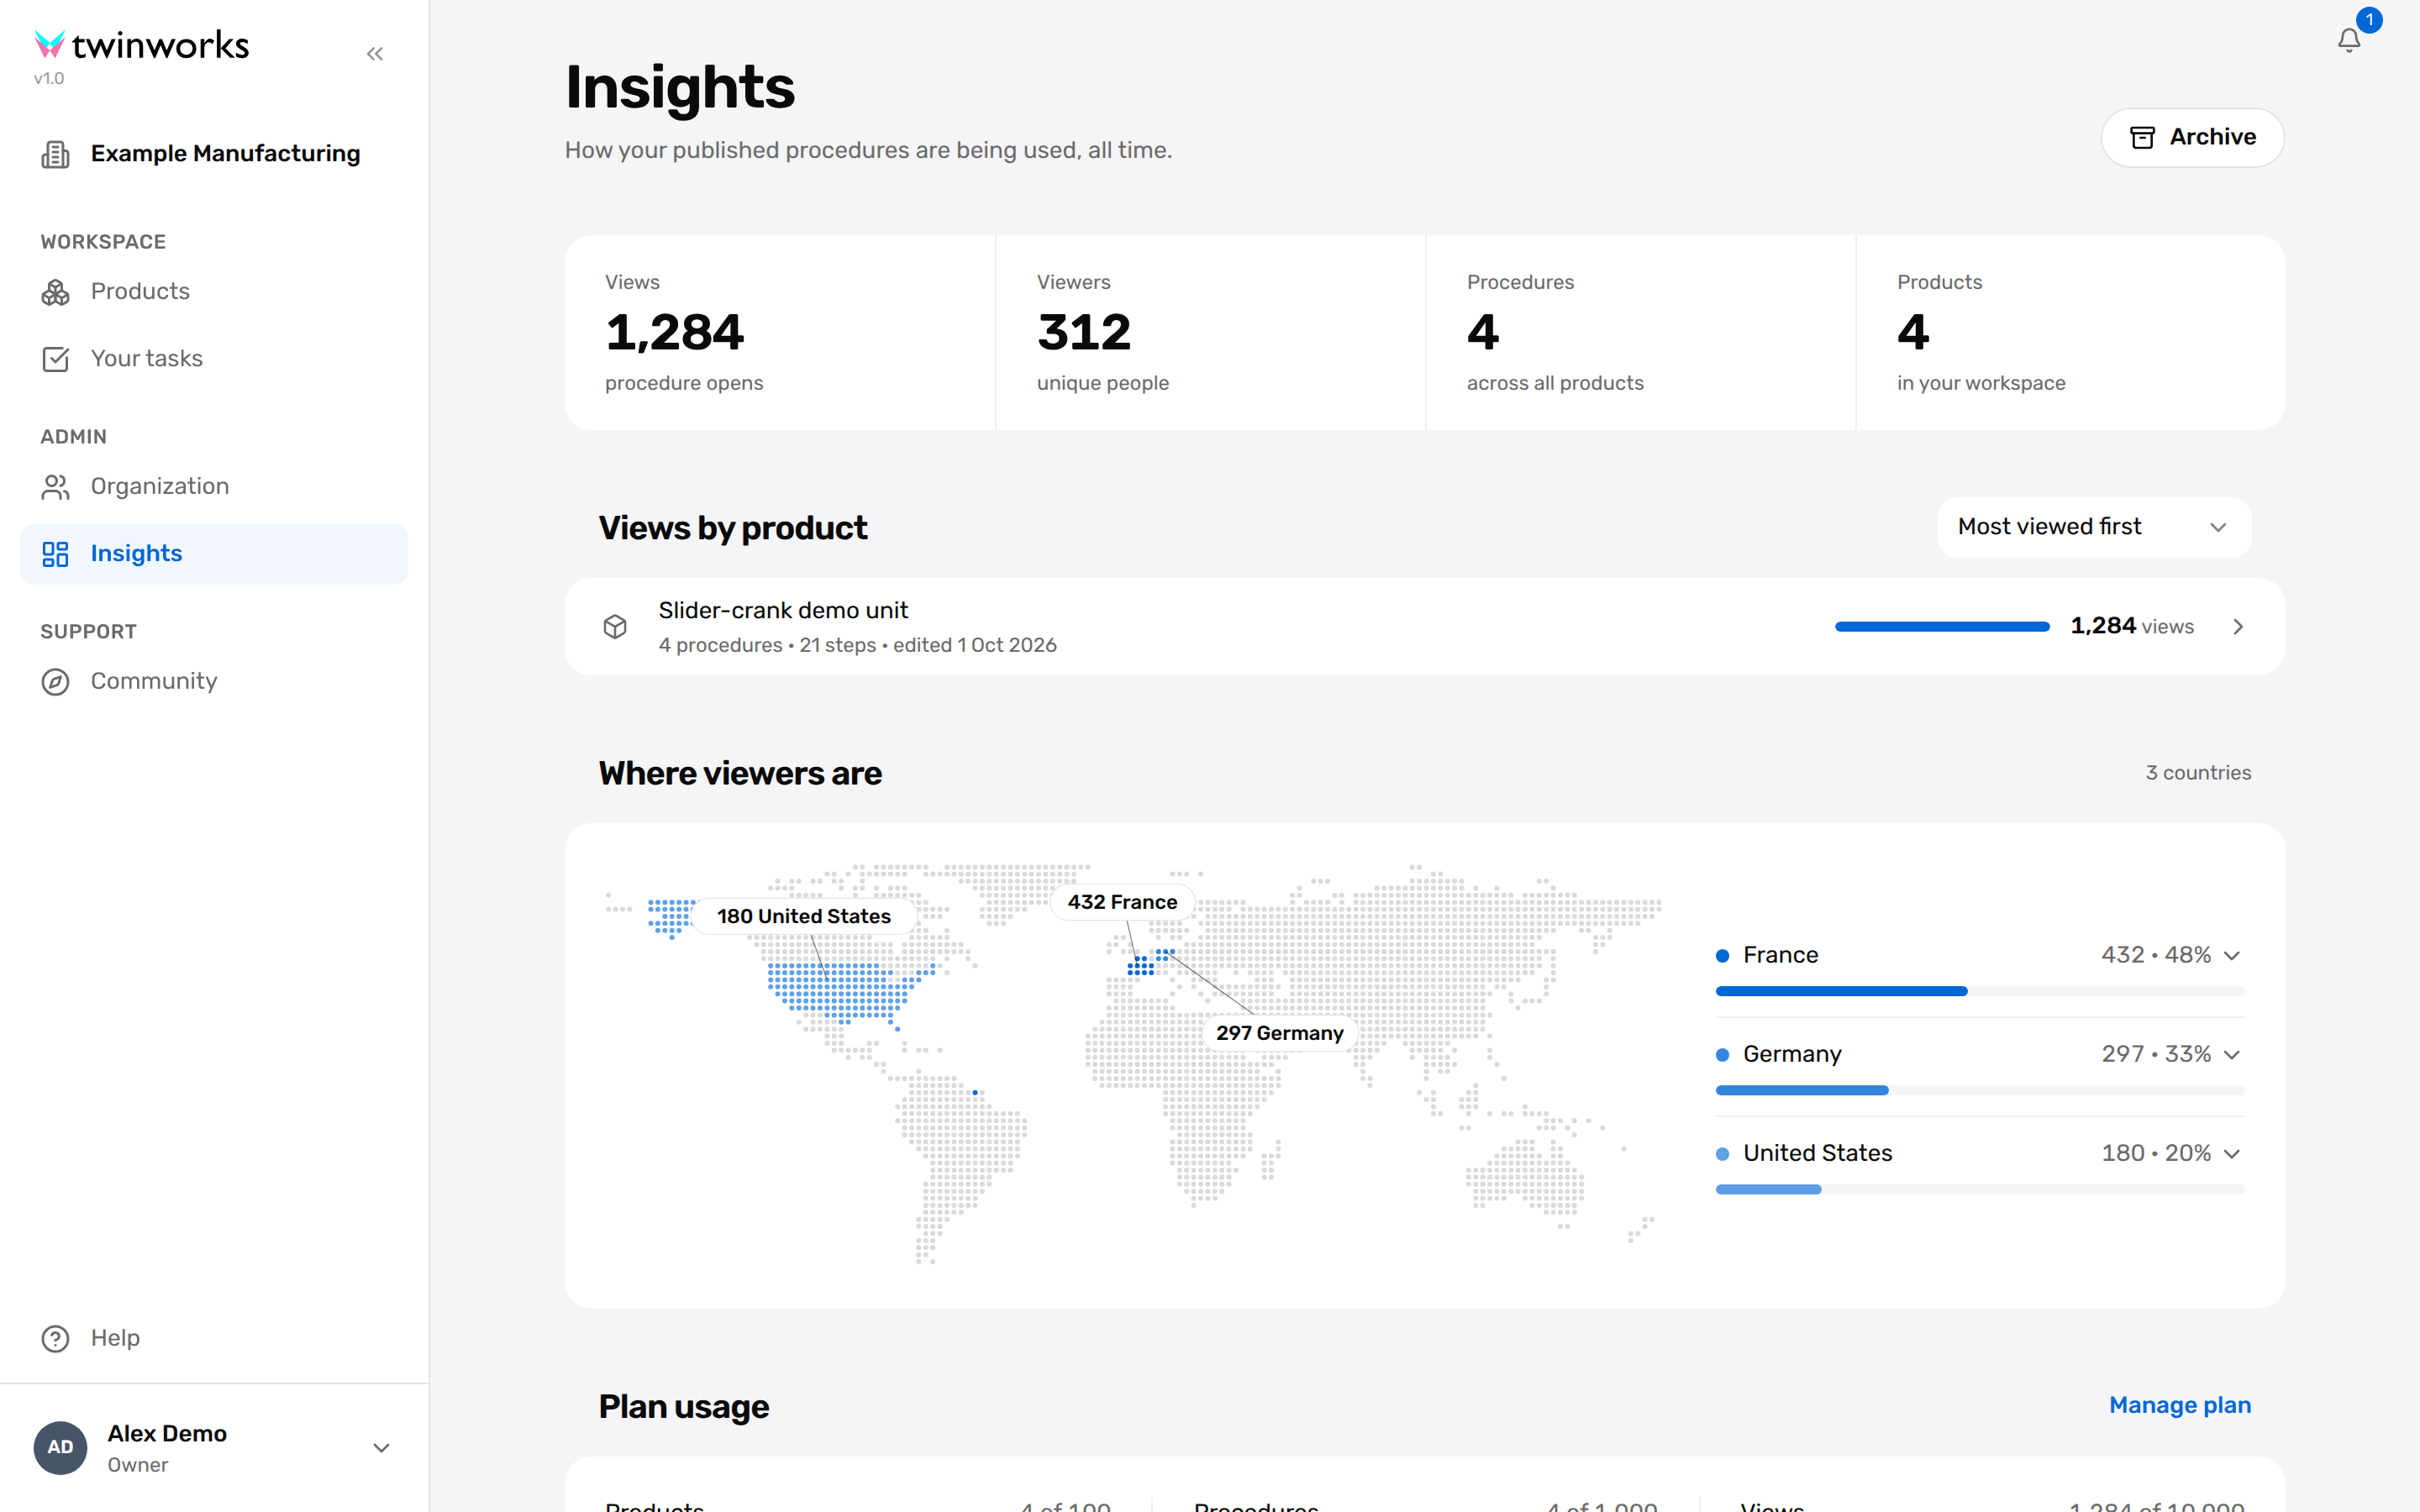
The current dashboard includes:
- Total Views
- Total Viewers
- Total Procedures
- Total Products
- a country distribution map
- plan usage limits
Open The Dashboard
Open analytics from the sidebar
Dashboard is for usage analysis, not authoring.
- In the left sidebar, click Dashboard.
- Review the top metrics for a high-level view.
- Use the product table to drill into a specific product or procedure.
If views are rising but completion quality is dropping, start on the main dashboard and then drill into the specific procedure analytics page.
Review Product Analytics
Open Product Analytics
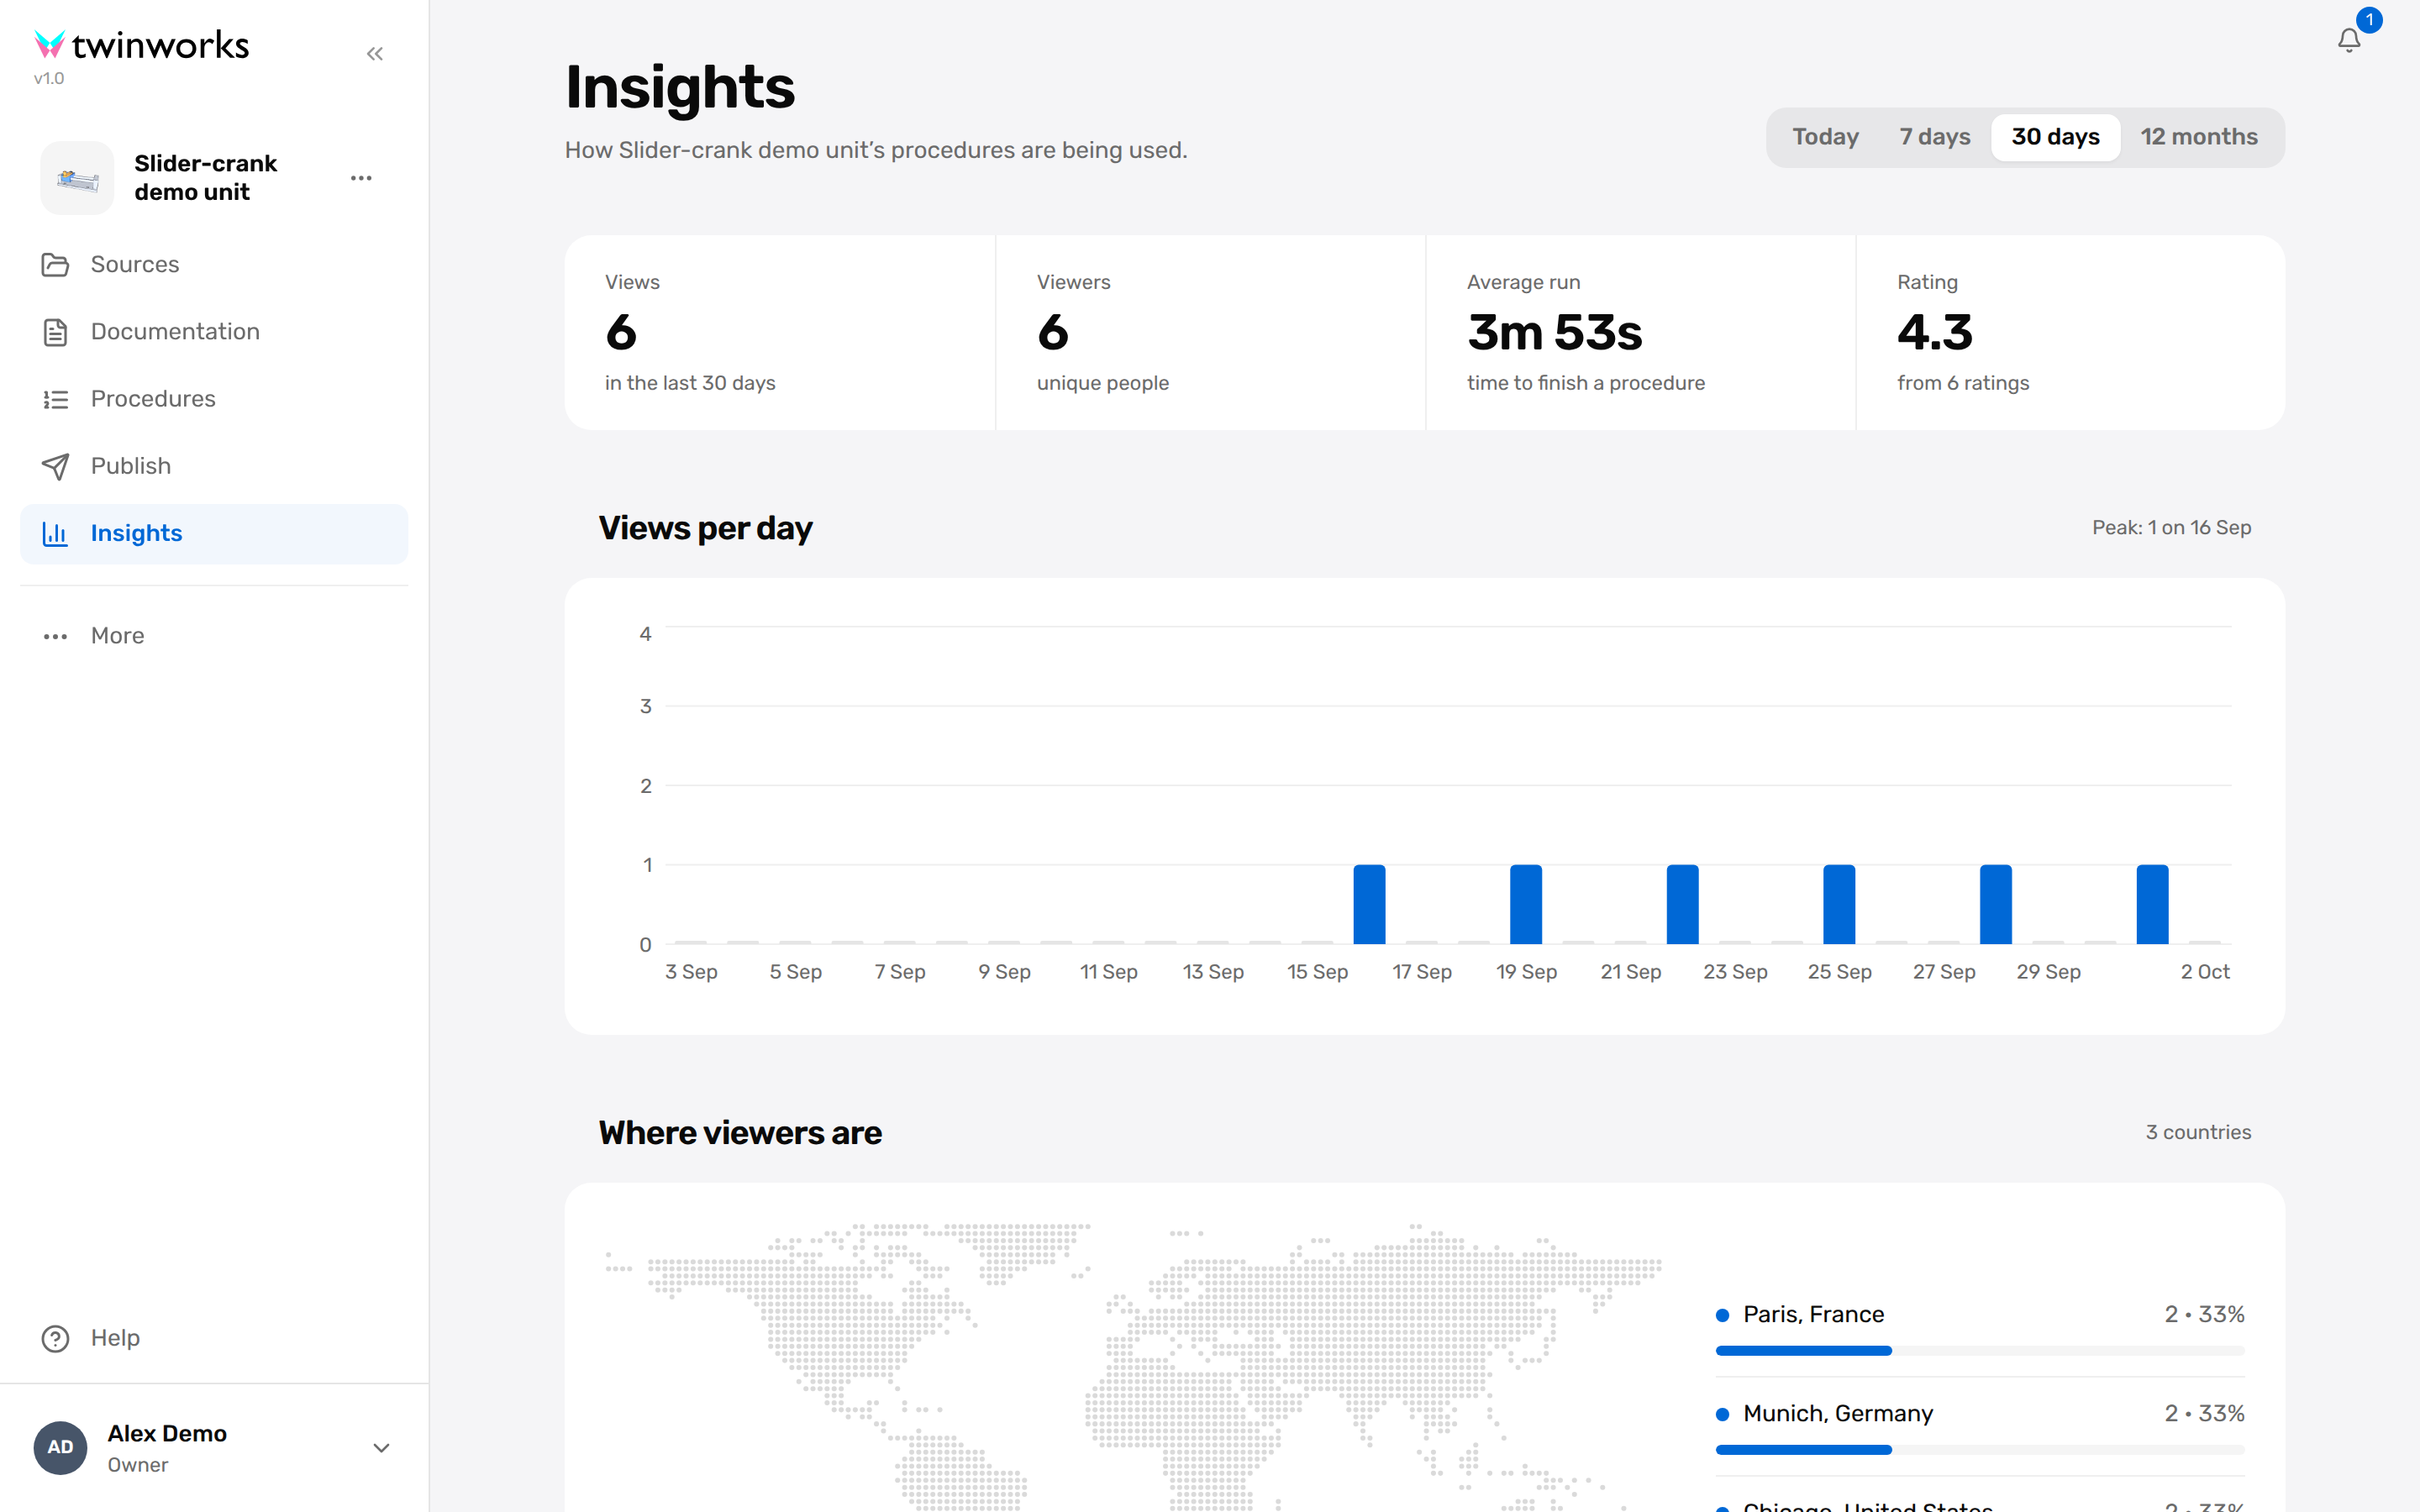
Product Analytics helps you understand how one product performs across its procedures.
- In the dashboard product table, select the product you want to review.
- Open Product Analytics.
- Review total views, viewers, and procedures.
- Check the trend chart.
- Review the procedures table for step counts and execution counts.
If one product has ten procedures but only two are being used, Product Analytics will show that imbalance quickly.
Review Procedure Analytics
Open Procedure Analytics
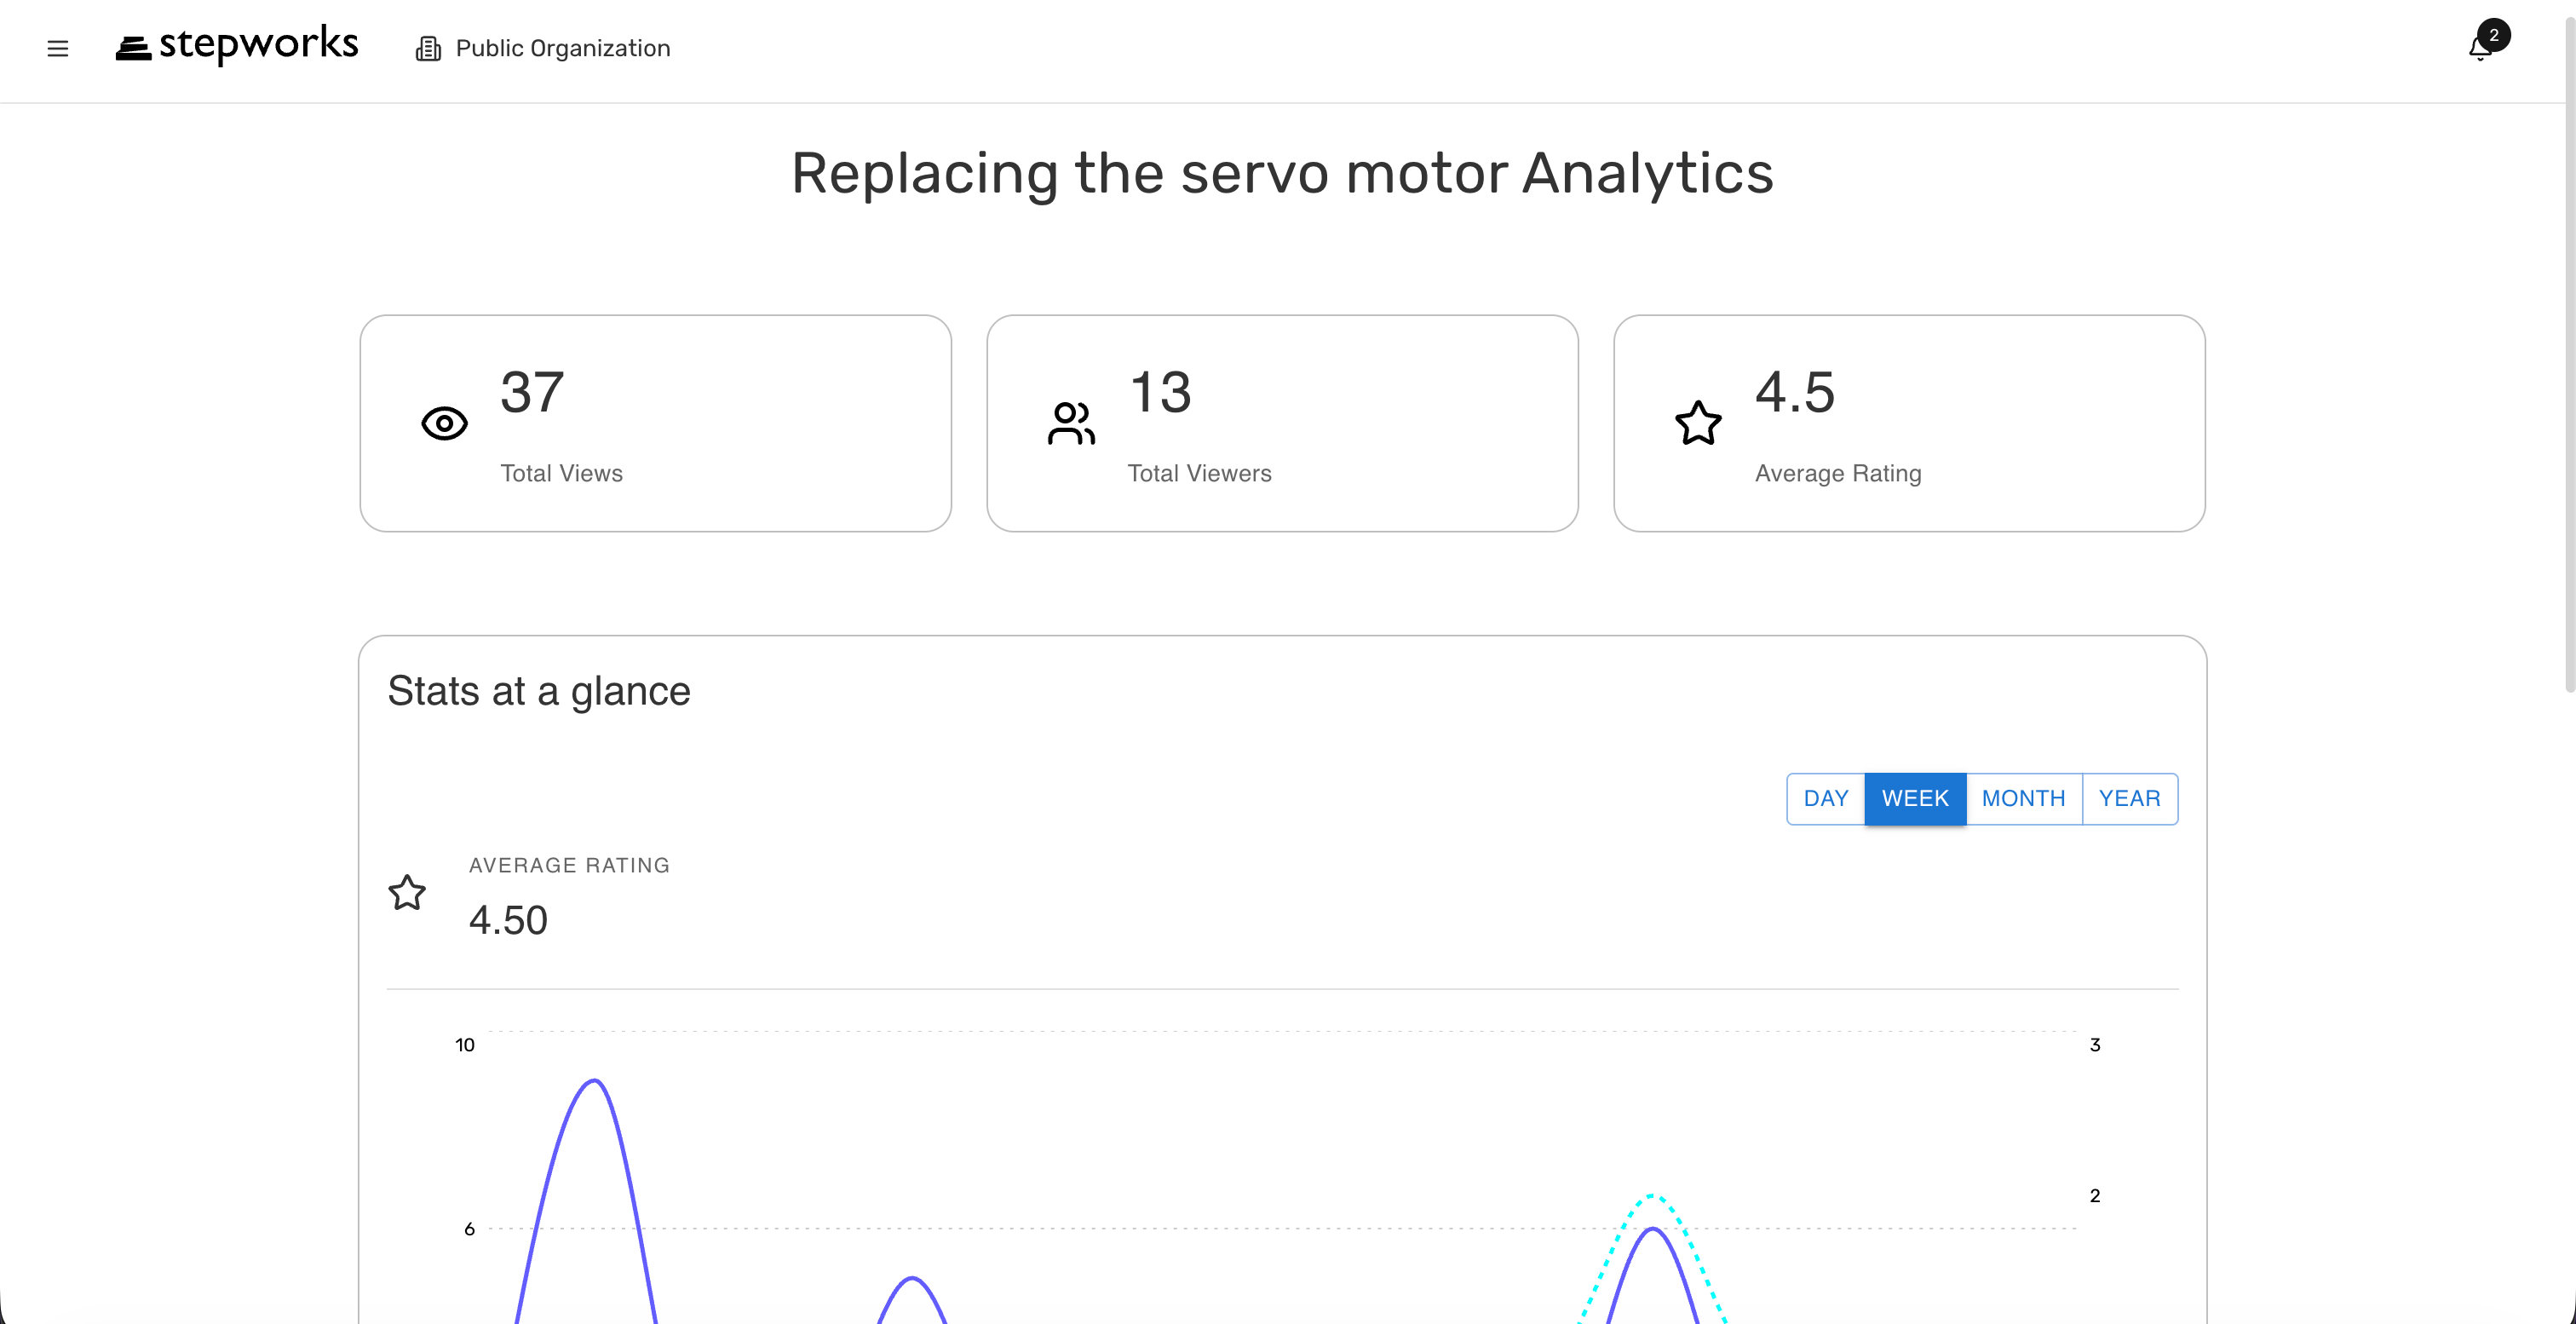
Procedure Analytics is where you compare public and private execution behavior.
- Open the relevant procedure from the dashboard flow.
- Review total views, total viewers, and average rating.
- Use the Public view for anonymous or link-based traffic.
- Use the Private view for authenticated runs and reporting data.
- Export the private execution data to Excel when needed.
If users report confusion in the field, open the Private view and compare ratings, comments, elapsed time, and step-level evidence from reported runs.
When To Use Dashboard
Use Dashboard when you need to:
- find highly used procedures
- compare product performance over time
- review private execution results
- inspect comments and uploaded photos
- export audit data